Before most outings the same three questions return: what am I looking for, where are the better chances today, and what else can improve the odds.
I live at the foot of the Utrechtse Heuvelrug in Amerongen. The difference between an incredible morning with some great sightings and moments, and one without any or few wildlife sightings, can be made or broken by my choice of game trail or viewing platform. A kingfisher that was active along one stretch of water yesterday may be quiet today. Roe deer that were visible at a woodland edge at dawn last week may have shifted their foraging habits. The difference is often no more than a single trail or the angle of first light on a particular edge of trees. I wanted a way to speed up the information gathering that normally takes years of field experience in an area. With wildlife nothing is guaranteed of course, but animals are habitual by nature and a tool that sped up my fieldcraft process would be a life-saver. I called this idea Faunaradar.
I realized I had one big advantage in this process: The information already exists. The Netherlands has one of the densest and most active observer networks in Europe. Mammals, birds, amphibians, and reptiles are logged every day on waarneming.nl by thousands of people. The data is carefully validated and made available for research and wildlife enthusiasts alike. The problem is the form in which it’s accessible isn’t compatible with how I intended to use it. I needed a practical field tool, a sort of Pokémon Go for wildlife photographers, rather than reams of species lists and coordinates.
And that is just what I have built. Though it took me several months and a very bumpy database development process Faunaradar is out of its alpha and officially live and free to use.
What is Faunaradar
Faunaradar is a free, interactive map of recent wildlife sightings across the Netherlands. Open it to explore hundreds of observations near you or anywhere else. Grant location access and the map centres on your position with a 50‑kilometre radius; zoom in for finer detail. You can also jump directly to a town or region, pin an observation to Google Maps, or filter by broad groups (mammals, birds, amphibians, reptiles). Toggle between a 30‑day window and a full year to view different spans of observation history. With over a million observations in 2026 alone, the map can become overwhelming and cannot render every record at once, species view helps solve that by narrowing results for clearer exploration.
Select a single species and apply the map filters for it; a detail tab opens beneath the map. The map shows all recent observation locations, and the tab presents three additional data items derived from those observations: recent hotspots (based on sightings over the past several weeks), best times to observe the species (from observation timestamps), and noteworthy behaviors (for example, calving seasons, migrations, or breeding displays). These indicators are not perfectly predictive, but they provide valuable, data-driven context.
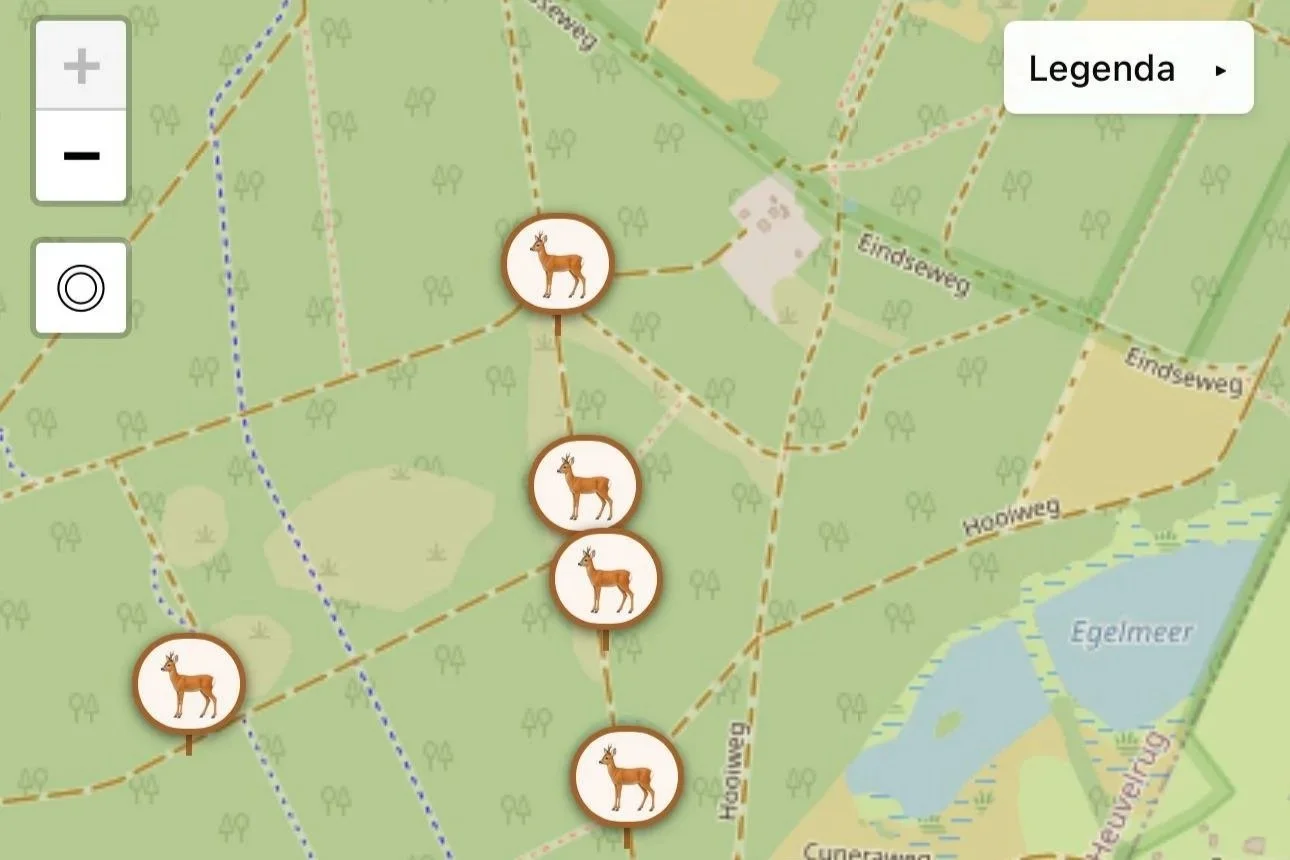
This is a classic example of a location where Faunaradar can add some luck to your day. All of the paths in this area are used frequently, yet one has significantly more observations. Stand on that path and the reason becomes visible: longer grass before a dense treeline, more game trails cutting through the edge, and young saplings that pull the deer into the open. All of these things I can identify myself of course, but with Faunaradar I don't have to stumble across it by chance.
To flesh out Faunaradar as a field tool I also added public hides, screens and viewing platforms to the map and in their own window in the app. There are more than six hundred of them, spread across all twelve provinces, from the Wadden coast to Limburg and from the Zeeuwse delta to the wetlands of the Wieden. The coordinates come in part from the open Vogelkijkhut.nl database, checked and supplemented with my own field notes and visits. The hides layer is, for me, one of the more useful parts of the map when combined with the species view. It lets you see recent activity and a practical viewing point at the same time, especially valuable when you want to photograph from a fixed, low-impact position.
Every observation pin links back to its original record on waarneming.nl. The map does not store your location. There are no user accounts, no advertisements, and no commercial features.
Faunaradar is a free field tool for wildlife photographers. Supporters may make voluntary donations to help cover server and maintenance costs; donations are optional and do not unlock extra features.
Where the data comes from
The observations are drawn from the open dataset that Observation.org (and its Dutch platform waarneming.nl) publishes to GBIF, the Global Biodiversity Information Facility. GBIF is an international infrastructure that gathers biodiversity records from research institutions, museums, government surveys and citizen-science platforms and makes them freely available under open licences. Observation.org is one of its larger contributors. Dutch records appear in GBIF after they have been validated, and often after a delay of days or sometimes several weeks.
I use that public feed deliberately. The internal API of Observation.org is reserved for partners and funded projects. For a free tool with no commercial intent and no institutional backing, the open GBIF dataset is the most accurate source I have available. Credit stays with the original observers and the validators who check the records. Sensitive or protected species already receive generalised coordinates at the source; Faunaradar never attempts to refine them or to infer more precise locations.
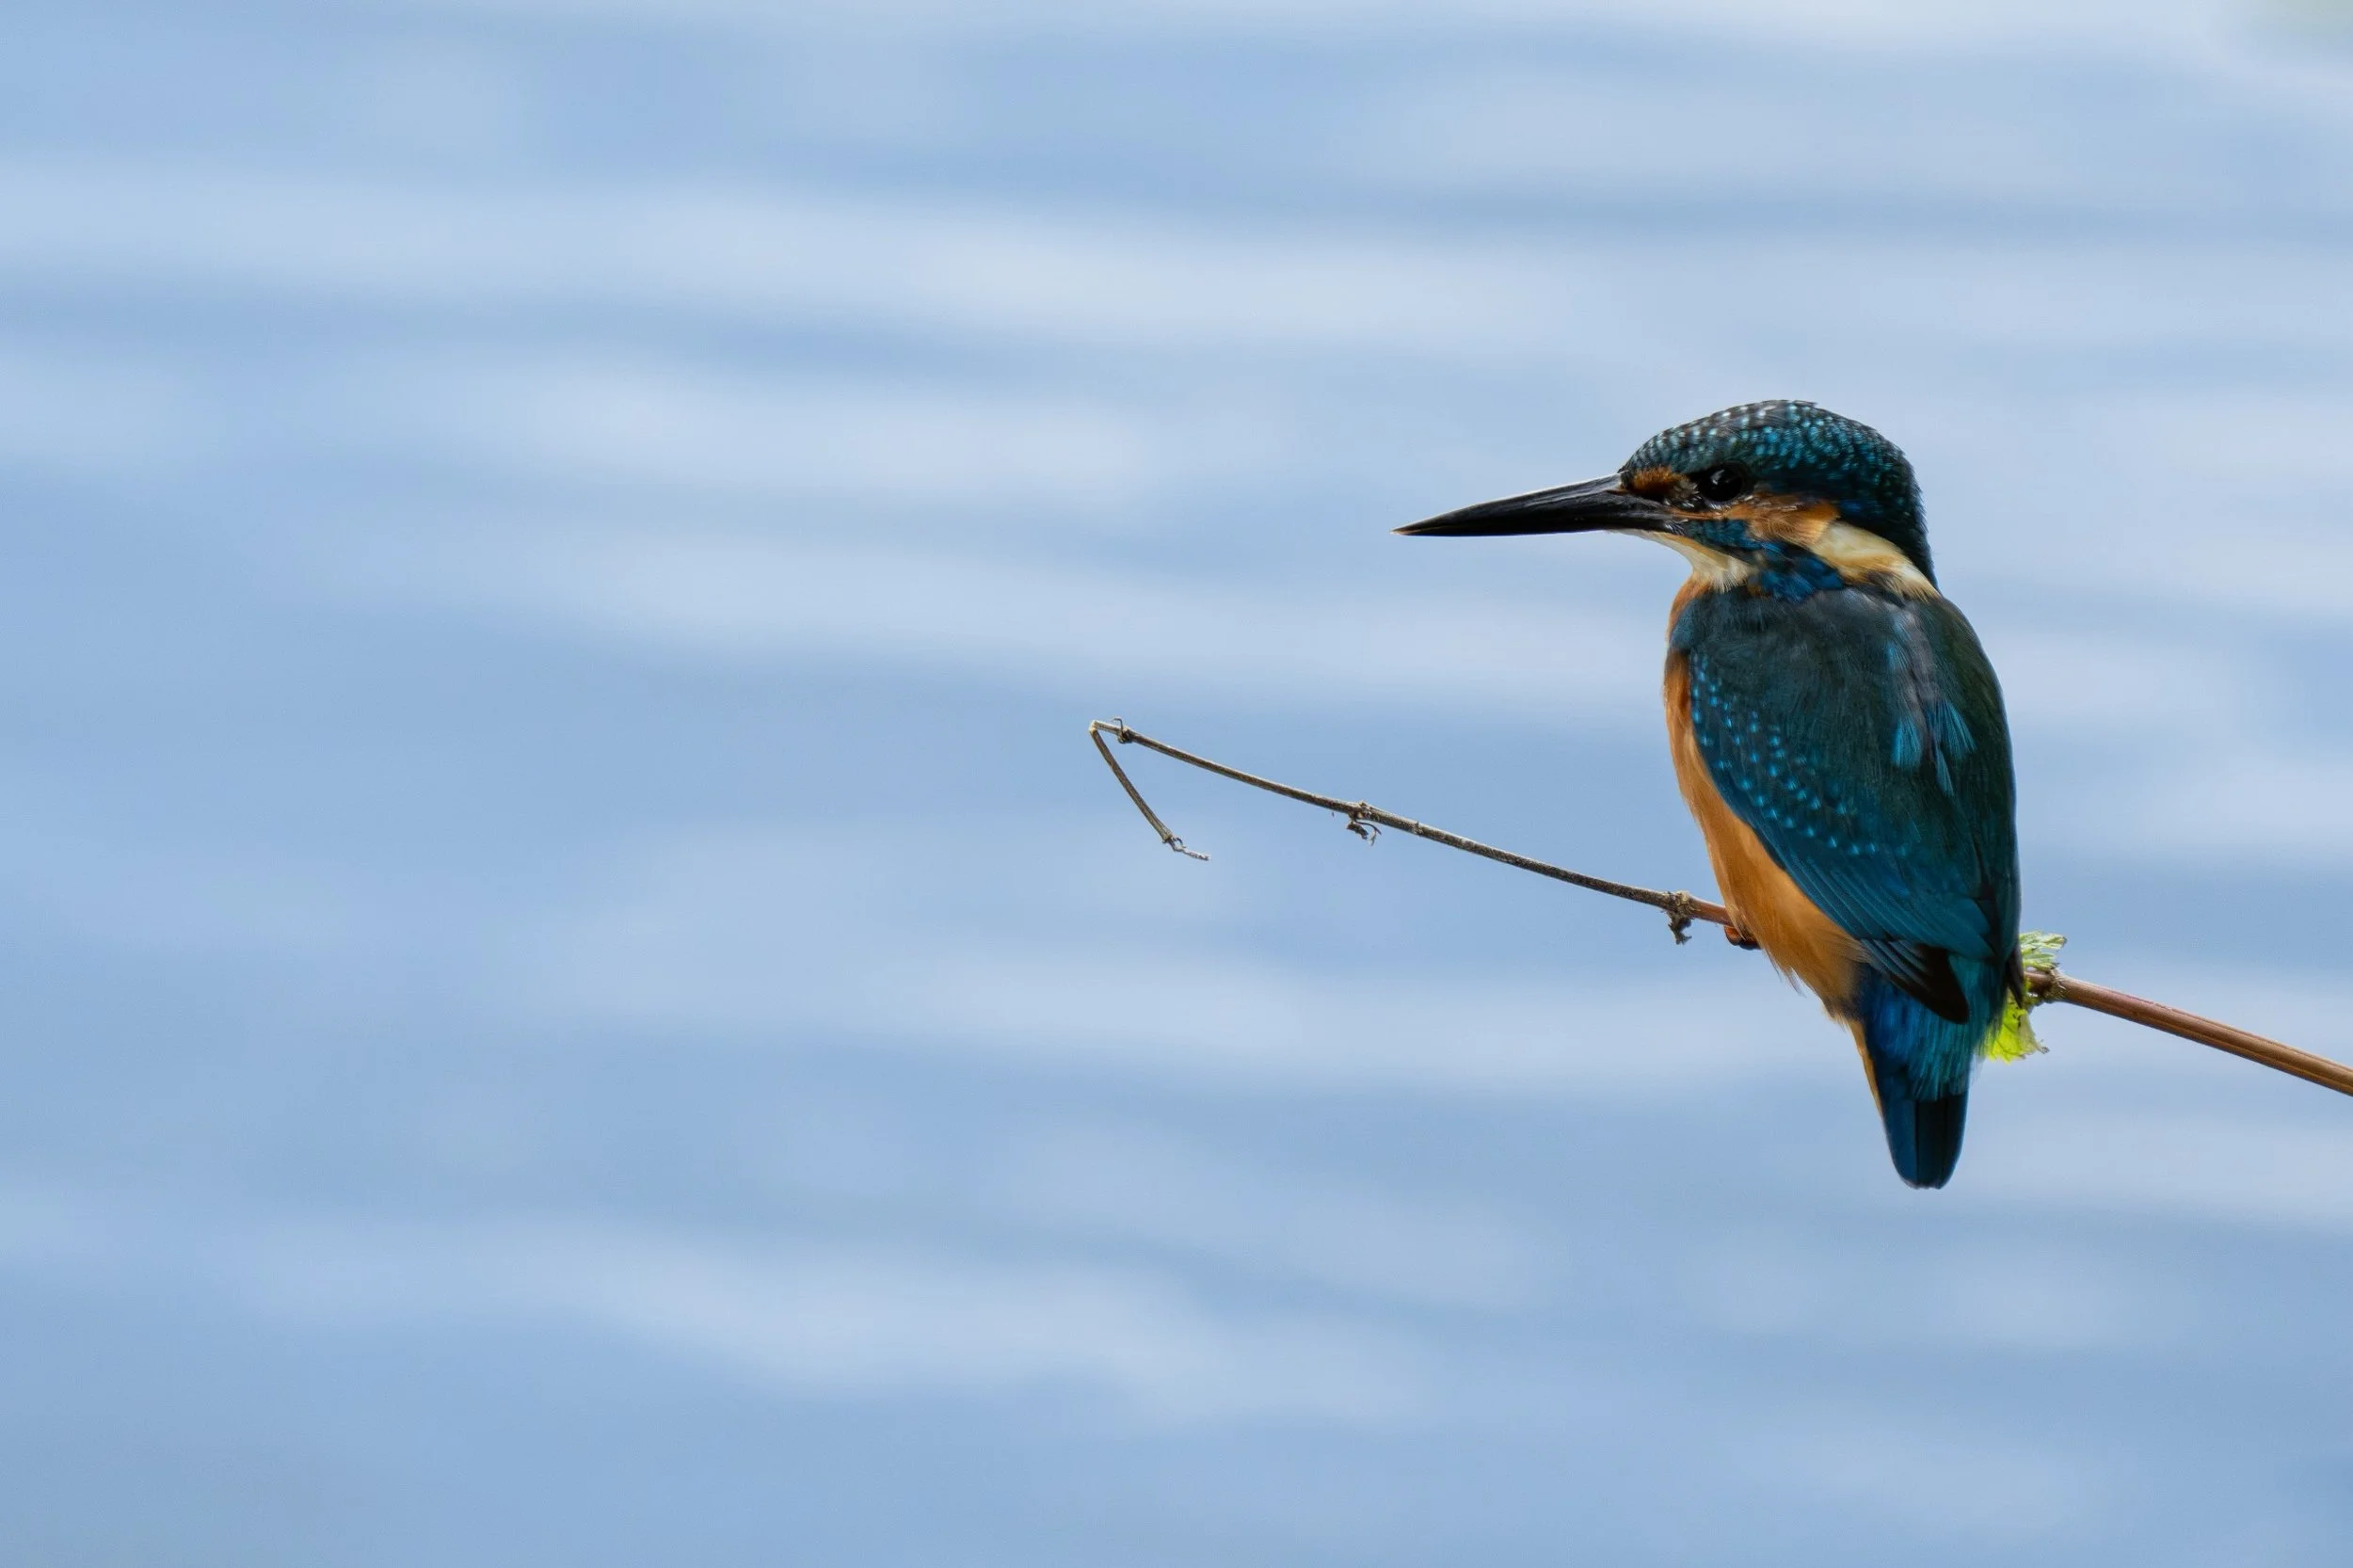
This kingfisher shot was made possible largely thanks to Faunaradar. I knew that there was a healthy population in the Utrechtse Heuvelrug, but it's a very large area with a myriad of small and large waterways and rivers. Not all locations have good observation spots, and not all locations or areas have the same number of kingfishers. By seeing recent observation coordinates, I knew where to go for the most visible and observable chances, as well as their likely haunts.
How to use Faunaradar
The main practical advantage is spatial overview. Instead of holding a list of locations in your head you see recent activity distributed across the landscape. In a few seconds you can tell whether the last fortnight’s kingfisher records are concentrated along one particular watercourse or scattered across the myriad little waterways along the walking paths between the large rivers. You can see whether a species is currently being reported more often in the early morning or in the late afternoon in a given area. You can check which public hides sit near that activity and decide whether the morning is better spent at one of them or walking across the open fields with your eyes on the tree line.
The time-of-day patterns are especially useful for wildlife photography. Many species follow strong daily rhythms. Knowing that most recent reports for a particular mammal fall between 06:00 and 09:00, or that a bird is being seen more often in the two hours before dusk, changes how you allocate limited good light. This is critical because, while there are general rules for animal behaviour, local conditions can alter when and why animals are active. Roe deer, for example, are crepuscular, most active around sunrise and sunset, so these times are usually the best for spotting them. In the Utrechtse Heuvelrug, however, heavy afternoon human activity from mountain bikers and joggers changes this up, making the deer much more visible at sunrise with few observations at sunset. That pattern isn’t universal: nearby areas such as the Veluwe, only about 40 kilometres away, can show a much more even distribution of sightings throughout both crepuscular cycles.
The combination of live observations and fixed viewing points is more useful than either alone. A cluster of recent pins near a public hide gives you both a reason to go and a place from which to watch without leaving the path or pushing into sensitive ground. That is one of the subtle ways the tool supports better field behaviour and more considered photography.
What it does not do, and how to read it honestly
Faunaradar isn’t magic or all-seeing. The data is collected by humans, which means observation bias is always at play. More pins do not always mean more animals. This is the most important limitation and the easiest to misread. Popular hides, well-known viewpoints and accessible nature reserves generate more records simply because more people visit them and more people log what they see. This is for example one of the reasons that the most sightings occur at the edges of cities, there’s just more humans around. A quieter stretch of forest or marsh with few observers can look almost empty on the map even when animals are present. The numbers therefore reflect observer effort at least as much as they reflect animal density.

Look up a specific species and get insights not just on where they get seen, but also at what time of day, and if any season or behavior of note is occurring, such as breeding season, calving season, or migrations.
The app becomes most valuable in natural areas such as national parks and Natura 2000 sites, where well-used trails produce detailed data on animal movement. In places with multiple paths, you’ll often see certain species consistently prefer a specific route to cross. By leveraging observation history, Faunaradar reveals temporal patterns and shows where and when wildlife is likely to be present at a given spot. With basic fieldcraft knowledge you can then interpret why observations cluster, vegetation, water sources, cover, slope, or human disturbance often explain the patterns. Experienced wildlife photographers may recognize some of these signs in the field, but Faunaradar helps you find them faster and more reliably.
You can also use this data to show which national parks offer relatively more sightings of one species versus another. One nature area may have significantly more marsh harrier observations, while another records more goshawks, even though both biomes satisfy the species’ needs and the total observations are similar.
The map does not show behaviour, individual identity, or breeding status beyond what the original observer noted. It does not replace local knowledge, weather judgement, or understanding animal behavioral signs. Used with those limits in mind, it becomes a powerful and useful live field guide, for both prep before an outing as well as on the go.
How Faunaradar changed my wildlife photography habits
Depending on the day I either start with a place or start with a species. Some mornings I already know which national park or nature area I’m heading to, and I use the map to see what’s been reported nearby and where the better chances currently sit. Other days I have a specific animal in mind and look for the area that offers the strongest recent activity. I check the observation history, note the time-of-day pattern, and look at the nearest productive hides or recent clusters.
Sometimes the answer is obvious: a clear concentration along a stretch of water, or a hide that has produced consistent records in the right light window. Sometimes the map simply confirms that the place I already had in mind is still active. Sometimes it sends me somewhere I would not otherwise have considered that morning.
Once I’ve chosen one or two locations I pin them in Google Maps and head out. From that point the ordinary work takes over: reading the light, watching the wind, keeping distance, and deciding whether to stay or move. If I do decide to change spot later in the day, or if I’m out for a full day and want to know whether the evening looks stronger somewhere else for red deer, I open the map again. It stays available without getting in the way.
One thing I did not expect is how quickly the map trained my eye. Once the patterns are visible on screen, the same patterns become easier to read on the ground: the game trails, the change in cover, the mast trees, the lines of sight, the places where the ground is soft enough to dig. I am not only learning where to go. I am getting better at seeing why a place works.
The tool does not make the photograph. It only improves the odds of being in the right place when one becomes possible. What I can say from my own use is that sightings per outing have gone up, and I come home with more frames worth keeping. Empty days still happen. There are simply fewer of them, and the days themselves feel more engaged. In that sense it has made me a better wildlife photographer.
Field behaviour
A quick note on field behavior: Every pin on the map is a record of an animal going about its life. The appropriate response is still the same: stay on paths where they exist, respect closures and quiet zones, keep dogs on leads where required, (and preferably always) never use playback or bait, give nests and resting places room, and leave no trace. If a sensitive species appears with a generalised location, that generalisation is deliberate. The map keeps it that way.
Trying out Faunaradar
Faunaradar is free and works in any modern browser. On a phone it can be added to the home screen so it opens without the browser chrome and sits with your other apps. You will find it at faunaradar.nl. Want to make your own observations? You can log them on waarneming.nl or via their app. Your observations will appear on the app once they reach the public GBIF dataset. Faunaradar makes existing public data easier to use in the field, and field use should still feed back into the same shared record. This means any observation you make helps Observation.org get the full picture of wildlife in the Netherlands!